


>We support
digital transformation
on the SAP Platform
Offer


SAP Projects & Services
Digital Transformation

KBJ Proprietary Solutions
Our Experts
KBJ proprietary software
- We deliver proprietary KBJ products
- We carry out the implementation of business processes required by legal regulations
- We provide comprehensive support for the e-KSF National System of Invoices
- We provide e-JPK reporting solutions
- We offer a range of ready-made, proven solutions that complement SAP functionalities
We create original, universal and at the same time flexible applications and solutions supplementing the standard functionalities of the SAP system. Our products are used every day in over a hundred companies from various industries. Thanks to the rich, comprehensive experience, expert knowledge and values, we create applications that are easy to implement, efficient and easy to use. Customers are the most important for us – we create and improve our applications for you. We are open to any suggestions and comments and we make every effort to ensure that you are satisfied with the cooperation and feel that you can always count on us.

SAP Application Development Department Manager
SAP dedicated solutions
- We support SAP S/4 HANA migrations and implementations
- We provide complete coverage of business needs
- We build tailor-made solutions in the full SAP HR and ERP range
SAP Best Practices is a great principle for implementing SAP solutions. Standardization of processes usually works well in at least 80% of the functional scope of ERP systems. What about the remaining 20%? What about the unique processes and requirements without which the operation of your company will be difficult or burdensome and time-consuming? When there is no support from dedicated solutions? Development is our ambition - modification, automation, functional enrichment of SAP solutions; All those areas that are the heart of your company and that enrich the SAP standard and at the same time they provide business users with "tailor-made" tools.

Director of the Development Department
New technologies
- We provide dedicated solutions
- We implement SAP systems integration
- We support the migration of processes to the cloud
- We create solutions based on Fiori, RPA, Business Technology Platform, BPM, CPI
We build customer-dedicated solutions in Fiori, Java, and iRPA technologies. We create portal, employee self-service, mobile and automation solutions for business processes. If you see problems in using the current SAP functionalities or have an idea on how to improve SAP in the above areas - contact us! We will share our experiences and those of our clients, we'll help identify the problem, find a solution, and we'll design and build IT modules that will improve your processes.

Development Manager
Get the facts
We have completed over 600 SAP projects over 17 years.
The majority of the team are experts with many years of experience in the SAP market.
More than 90 international SAP certificates confirm our commitment to continuous investment in team knowledge and competence development.
We provide solutions that are an everyday work tool for hundreds of thousands of people.
KBJ experts implement over 30% of all SAP trainings in Poland!
The first SAP partner listed on the stock exchange
Your intelligent enterprise

Find out about the - above the market average - profit plan

Join intelligently managed companies

Be ready to scale your business fast and easily

Perform a smooth, hassle-free digital transformation
Our latest product
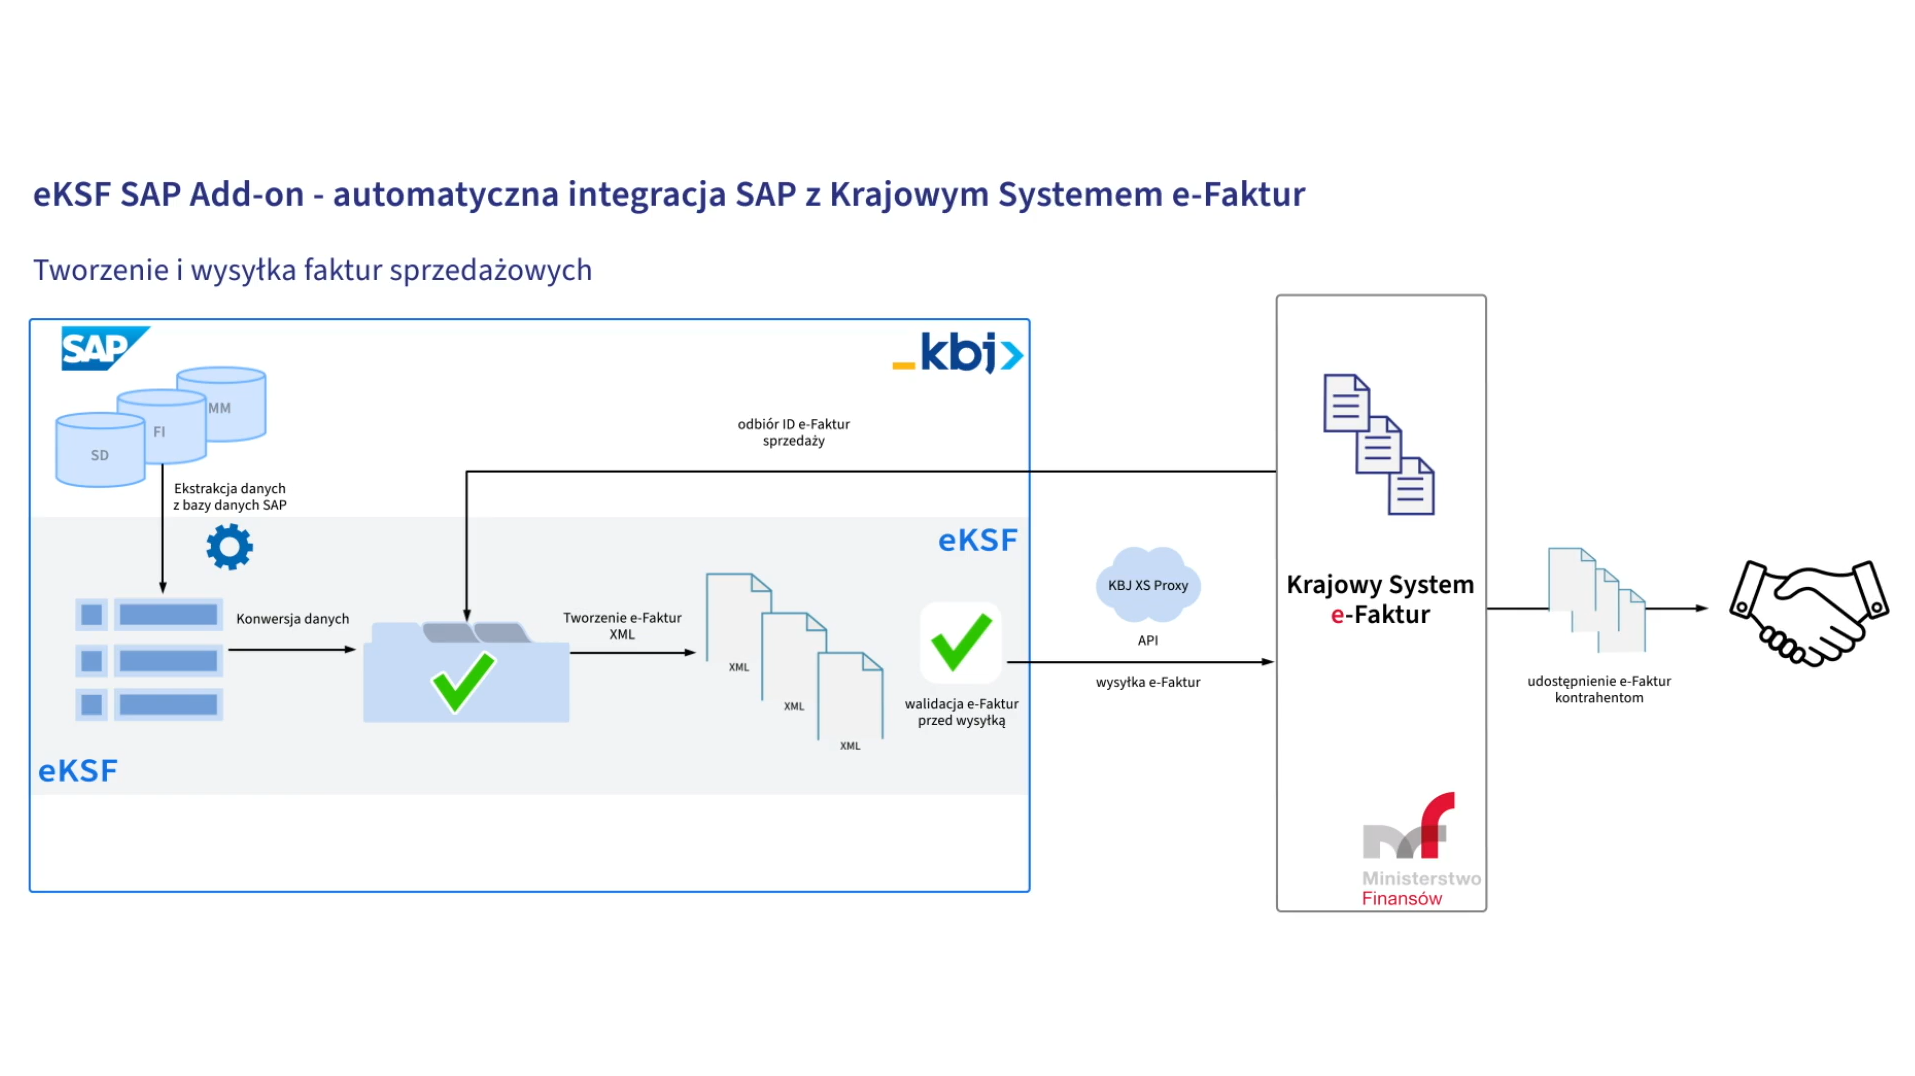
e-KSF
e-KSF is a friendly manager with a number of functions allowing the user to efficiently manage the invoice recording process in the enterprise.
e-KSF enables easy integration of SAP with the National System of e-Invoices (pl.: KSeF) and automatic handling of the process of sending and receiving structured invoices.
From the second quarter of 2023 structured invoice will become the only form of invoicing, and the use of the National e-Invoices System in Poland will become mandatory.
Find out why the e-KSF solution is right for your company!
They trusted us


